Applying Quantitative Literacy in History and Social Sciences
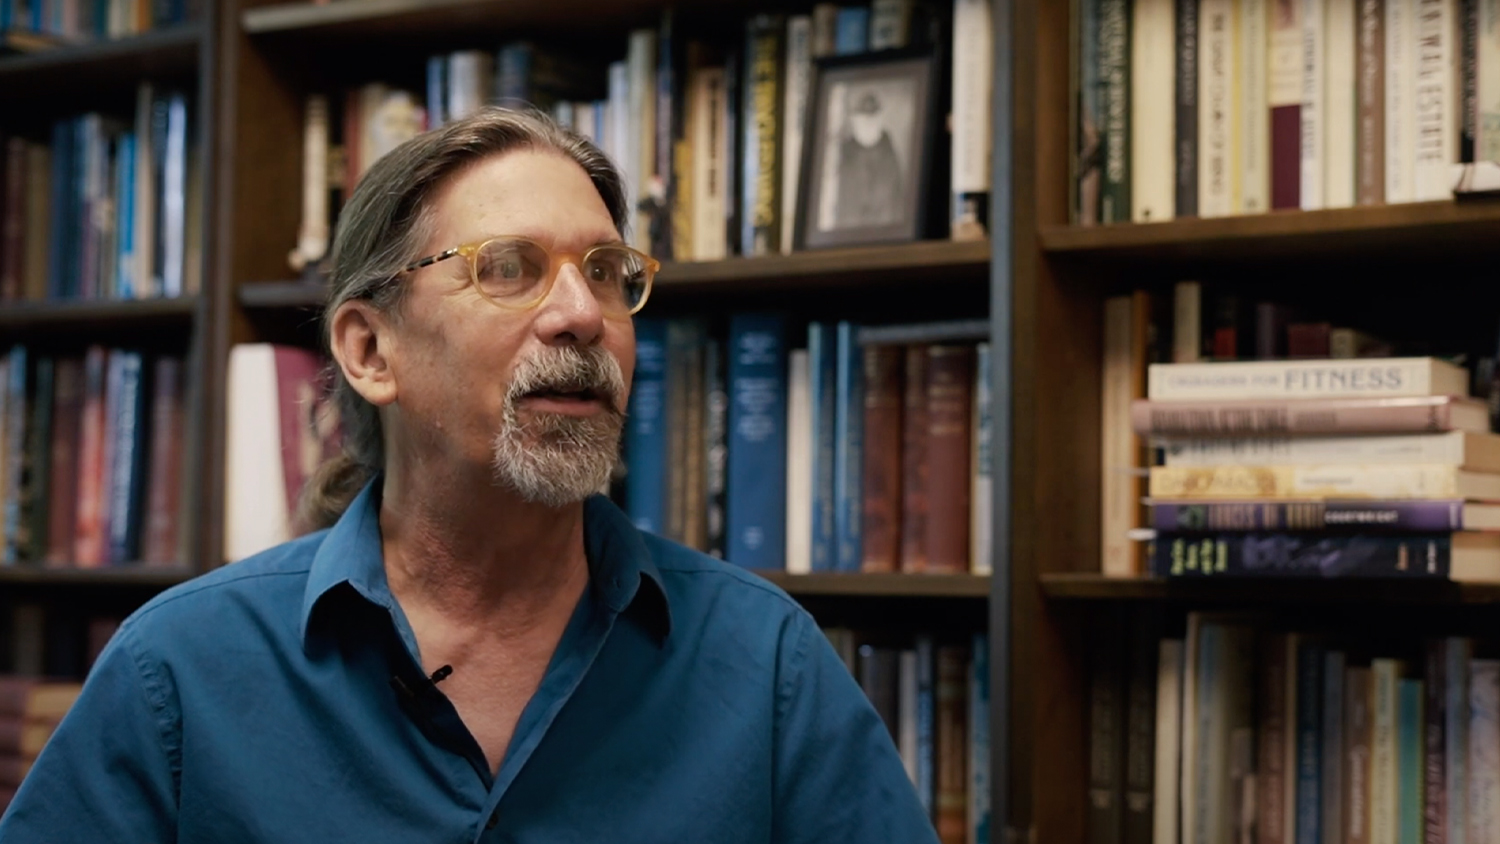
William Kimler, associate professor of history, describes how students in the College of Humanities and Social Sciences might encounter quantitative problems in their discipline and demonstrate their quantitative literacy skills after graduation.
By Samantha Rich, director of DASA Assessment
This article is part of a series on NC State’s Pack Proficiencies — the five skills faculty think all undergraduates should develop before they graduate: written communication, oral communication, quantitative literacy, critical thinking, and creative thinking.
NC State University is known for its prominent engineering, science and math programs, and this STEM emphasis can be traced back to the university’s land-grant mission. It’s no surprise, then, that quantitative literacy is one of NC State’s Pack Proficiencies. Quantitative literacy is the competency and comfort working with numerical data to solve quantitative problems. It is the expectation of NC State faculty and staff that all undergraduates develop quantitative literacy skills in every major.
NC State faculty incorporate projects and assignments into their courses that help students strengthen their ability to interpret charts, make inferences about data and solve problems — including history faculty! In the interview below, William Kimler, associate professor of history, describes how students in the College of Humanities and Social Sciences might encounter quantitative problems in their discipline and demonstrate their quantitative literacy skills after graduation. Interview excerpts are edited for brevity and clarity.
How do you define quantitative literacy?
I think of quantitative literacy as much more than taking a math class. It’s about that reasoning that comes from data. Competency means recognizing patterns and understanding how data are presented. Most of us get our information about quantitative data visually: it’s really those charts and pie graphs that you see in the news or in presentations about what the trend is right now. To really be competent in quantitative literacy means that you actually use it. We’re really talking about applications in students’ everyday lives. We’re talking about the ability to do things like make judgments. The kind of judgments you make about your own life or some trend out there in the culture are really important.
Why does quantitative literacy matter?
All of the Pack Proficiencies that we define are basically about being a well educated person. We think there’s a real value in being a university graduate. It’s good to be a thinker, a reader, an active person, an engaged mind in the world. You have a better life in some ways by being an interesting person, but also you’re a better citizen. For us, that means being engaged in a democracy, making decisions and communicating those decisions. That means having judgments instead of sitting back and thinking “everyone is going to figure this out for me.” Students should be able to look at a chart about the economy or something about climate change and think about costs, benefits and trends. And these hit a lot of hot button issues for us: incarceration, poverty, drug addiction, immigration. It becomes rather important for the citizens to be able to judge those things.
How do historians use quantitative data in their work?
History doesn’t seem like the obvious discipline where you would talk about quantitative literacy. But in fact, we all use quantitative data. Quantitative data help you find patterns and historians deal with patterns of change all the time. If you want to make a claim about the cotton market in the early 1800s and how that influenced slavery and emancipation, you ought to know whether it was the core of the economy of the Old South. How would you know that unless someone actually looks at economic data, import/export data and trade data?
I also think about contentious issues like the rate of Native American deaths after the arrival of Europeans, which we now know is largely from disease. But to know more about this population shift, you have to know something about how epidemiologists look at numbers and how they track populations, and then where the numbers come from. You know Native Americans weren’t counted properly… so where do the numbers come from? So now we get into oral tradition, archaeological evidence, documentary evidence and the reasoning from disease experts. So we watch the whole shift of that question, “What was the population of North America?” We observe the shifts with the different uses and application of quantitative literacy skills. We like to teach our history majors to think about how to blend all these types of evidence together.
What can students do if they want to further develop their skills in quantitative literacy?
The first thing to do is think about your own competency as a student. Most students want to come out and say “I have these quantitative literacy skills.” But look beyond course selection and filling out the degree audit. The Pack Proficiencies in some ways map to the General Education Program, but don’t think “because I took two math classes, I’ve checked that off, I’m done.” Think about the questions you’re interested in. If you’re interested in questions about quantitative patterns, maybe you need a sociology class that looks at demographics. Think about where you can get the skills that you’re interested in and start to cross-connect. If you’re interested in civil rights, maybe you want to take a political science course that talks about quantitative trends about patterns of voting or the growth of neighborhoods.
To learn more about the Pack Proficiencies and how they are assessed, contact the Office of Assessment or visit go.ncsu.edu/PackProficiencies.
- Categories: